It doesn’t make me wonder that, I know what Carleas is saying.
So do I, because Carleas isn’t talking about the only two possibilities that a coin has to land, he is talking about how many out of 100 flips, not heads or tails of the last flip.
I think Carleas has talked about both of those things in this thread.
He just showed why his ideas are contradictory. On one hand he thinks it’s more likely to end up 50-50 than 100-0, but on the other hand he doesn’t think it’s more likely to end up 99-1 than 100-0. It doesn’t add up, which is why I asked him to explain why he thinks 50-50 is more likely than 100-0. Justify that while at the same time denying that 99-1 is more likely than 100-0.
I don’t think it’s contradictory, but I’ll let him explain himself when he’s ready. Good luck.
Try this experiment. Using Flannel Jesus’s program.
Take any set that starts at the first flip and ends in a configuration that is not 50-50. There have been, say 365 heads and 322 tails. Calculate what that proportion is. Widen the sample to have more flips included but maintaining the proportion. Count if the following flip is heads 50% of the time, or more, or less.
The flaw in Flannel Jesus’s reasoning in the original thread was that a tail followed 4 heads 50% of the time, more or less, but between each intervening instance of the four heads was a sample that altered the overall 50 50 constitution. If it’s 4 heads, but preceding the four heads is a tail heavy sample, then a head is more likely rather than less.
Let me start here:
(image from here)
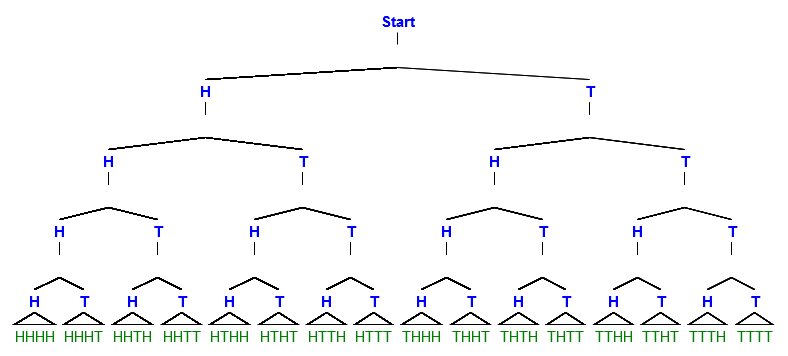
This is a binary tree of coin flips. It only represents the first 4 flips, but the principles I’ll use it to explain apply equally to a tree representing 100 flips.
‘Start’ is the point before any flips, and each branch of the tree from there represents a possible outcome of each flip. If the flip is heads (‘H’), we go left, if tails (‘T’) we go right. At the bottom, you can see all the possible sequences of flips: All the way on the left is the sequences HHHH (four heads in a row), all the way on the right is the sequence TTTT (four tails in a row).
There are 16 possible sequences of flips, and so 16 possible paths through the binary tree. We can count the total number of paths that produce different ratios of heads to tails. For example, there is 1 path, HHHH, where the ratio is 4:0. When we sum everything up we get:
| ratio H:T | count |
|---|---|
| 4:0 | 1 |
| 3:1 | 4 |
| 2:2 | 6 |
| 1:3 | 4 |
| 0:4 | 1 |
As we can see, if we’re standing at ‘Start’, a 50-50 outcome is the most likely: there are 6 possible paths that will get us there.
But if we’re already seen three flips, and they’ve all been heads, we aren’t standing at start, we’re standing at the red circle on the lower left in this image:
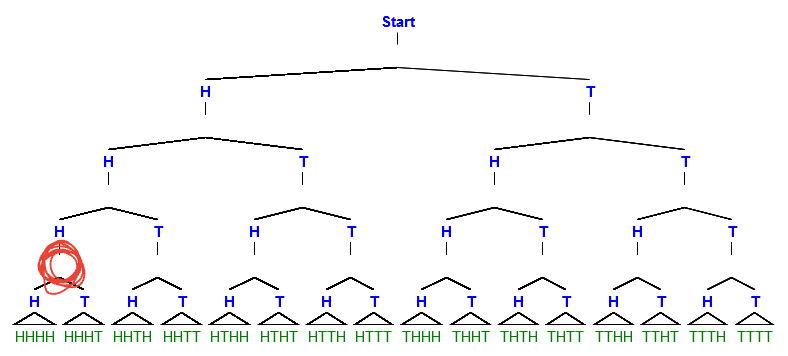
From there, there are only two paths: HHHH and HHHT. And the fact that there are 14 other places where the sequence might have gone from ‘Start’, none of those are reachable from here, there are exactly two possible outcomes, and they are both equally likely.
The situation we see from ‘Start’, i.e. 16 possible equally likely outcomes, is the reason why I see 50:50 as more likely than 100:0. The situation we see from the red circle, i.e. 2 possible outcomes, is the reason I see HHHH and HHHT as equally likely given HHH.
If you believe that a coin has a 50% chance of landing on heads, then you must also believe that for any number of flips it will be more likely that it will land on heads 50% of the flips. So for 100 flips it is less and less likely to have a greater number of heads than 50. So it is most likely to land on heads 50 of 100, and less likely to be 51 heads of 100, and even less likely for 70 heads of 100, and even less likely for 90 heads out of 100, and even less likely for 99 of 100 to be heads. So when the score is 99-0, it is less likely for another heads, because 99-1 is more likely than 100-0.
Right, I mean, if what Carleas was saying was true, we would expect a 100 flip set to be almost random, to give almost any proportion by the end.
In fact, it is almost always very close to 50 heads and 50 tails. It is even closer if you increase the number of flips.
Right, because there is a 50% chance of each flip landing on heads and that translates to 50% of the flips landing on heads. 50% of flips landing on heads is the most likely outcome, and increasingly less likely for a greater percentage to land on heads. Damn near impossible for it to land on heads 100 out of 100 flips, and a little more possible for 99 of 100 to land on heads.
So when the score is 99-0 it is more likely to land on tails than heads, because it is more likely for 99-1 than it is for 100-0.
You are mixing apples and oranges.
We are talking about how likely it is to reach HHHH from the start, not from the red circle. When we talk about 100 flips that is from the start, not from the “red circle” or flip 100. Just because you made it to the red circle or flip 100 doesn’t change how likely it is from the start.
From the start it is most likely to land on heads 50% of the flips and the least likely to land on heads 100% of the flips. It is still the least likely at flip 100 when the score is 99-0 to have 100 heads out of 100 flips. That means it is more likely to be a tails than heads on flip 100, because 99-1 is more likely than 100-0.
Well, it’s much more likely to be 50-50 from the start, does that mean that when the score is 99-0, it’s more likely to be 50-50 than 100-0 after the next flip? If not, why not?
1 Like
It’s probabilistic, not a hard number.
Therefore, it’s likelier to trend toward 50-50 than toward 100-0. Therefore, 99-1 is likelier than 100-0.
The answer is yes, therefore it is likelier to be tails.
So I did a little fiddling around with Flannel Jesus’s program.
My goal was to get a counter for what the next flip would be after the totality of previous flips had a significant tails bias, that is, significantly more tails than heads.
Due to the implacability of statistics, it was very hard to catch it with any significant imbalance.
What I did was increase to 10,000,000 flips, and have it count the next flip whenever the total amount of flips divided by the total amount of heads gave more than 2.1, indicating a small but significant bias towards tails (about 47.62 heads for 52.38 tails) .
You will notice that, while there will be some outliers, the count pretty consistently favours heads as the next flip.
You will also notice that the times it does favour tails, it does so at most by about 53%, while there is basically no limit for how far the percentage for heads will go.
Here with 100,000,000 flips. It then basically never favours tails, and gives a much tighter range. On the downside, it takes a couple of seconds to compute.
edit
Hahahahaha ok my program is kind of whacky. For example, I noticed that small numbers always favour heads, while large numbers almost always favour tails. Of course, the longer it spends “out of bounds” towards tails, the likelier it is that a tail imbalance led to more tails (duh).
If it favours heads, the trend will correct back to “within bounds” and there will be less overall tails heavy flips.
Maybe I should correct it to give total heads and total tails, so that we can compare total imbalance with per 2.1 flip imbalance.
You’re doing the same thing origami did, which is deciding to throw away flips when they don’t suit you. If you want to program a test of anything, let’s program it from scratch, reasoning through it one step at a time.
For example, I could write a program that tests what motor said about if the previous 99 flips of a 100 flip session were 75% heads, then the 100th flip would be more likely to be tails.
I could test that.
No, but you wouldn’t control for the proportion of the overall sample, that was the same mistake you made last time. Cherry picking data.
Here is my tightest program yet. It is a variation of the last one, but it just measures total heads, total tails, then heads when more tails have been flipped, however many and the same for tails.
You will notice that the percentage for heads when more tails than heads have been flipped is about 9 out of 10 times, if not more, higher than than the percentage of heads total.
See for yourself:
I am entirely unwilling to look at any program that we didn’t reason through from scratch. Origami liked to throw away inconvenient flips, because he realised that when you consider ALL flips, the data supports what I said.
We can reason through it one function at a time, or not at all. I’m not interested in modifications to my function that try to find clever ways to throw away data if I haven’t accepted the reasoning for throwing that data away
What this obviously means is that there is a measurably higher likelihood for a specific flip to be heads than tails if the previous flips from the beginning contain more tails than heads than if the previous flips from the beginning contain more heads than tails.
This is per individual flip.
Check mate Flannel Jesus.