Econ-102 raise/lower taxes?

If the government raises taxes do revenues increase to pay off the deficit or increase government programs? Disregarding other factors such as government large or small (what’s that like) government spendig, or the economy being robust or limp (and they are tied together), the answer is very simple as has been demonstrated by past tax cuts and increases.

The Laffer Curve

Tax hikes on the left side increases government revenues, and contrariwise, ones on the right lower revenues. Most notably, tax cuts under JFK, Reagan and Bush II did increase revenues–under Reagan, dramatically, even though gov. spending was increased. The tax hikes in the 70’s lowered revenues and trashed the economy under Carter.

It is arguable where t* occurs at which our economy is optimized (probably around 25%), but it’s usually easy to tell if you’re too far off to one side or the other–and right now, with our current economy, we’re way off to the right (which is Left of course.)

And since this is Econ-102, the second point is that economics is not a zero sum game. If the rich get richer, the poor get richer as well–IN AN ECONOMICALLY FREE COUNTRY. Or, as JFK said, a rising tide lifts all boats.
A nice theory, but it fails to be predictive:

Let’s compare per capita GDP of the states and compare that to their share of the tax burden. The order is: per capita GDP rank, total per capita tax burden, state name, and GDP per capita. I’ll just do the first 25 to get a good sampling:

0 n/a District of Columbia 64,991
1 3 Connecticut 56,248
2 8 New Jersey 50,919
3 7 Massachusetts 50,735
4 2 Wyoming 49,719
5 15 Maryland 48,091
6 11 New York 48,076
7 22 Alaska 43,321
8 31 Virginia 42,876
9 47 New Hampshire 42,830
10 4 Minnesota 42,772
11 9 California 42,696
12 25 Illinois 42,397
13 48 Colorado 42,377
14 13 Washington 42,356
15 14 Rhode Island 41,008
16 5 Delaware 40,852
17 1 Hawaii 40,490
18 23 Nevada 40,353
19 20 Pennsylvania 40,265
United States average 39,751
20 29 North Dakota 39,321
21 36 Florida 39,070
22 6 Vermont 38,880
23 50 Texas 38,575
24 28 Kansas 37,978
25 18 Nebraska 37,730
2004 Rankings (Historical)

So, 17 of the 25 (68%) most productive states per capita are within the top half of the per capita tax burden. This becomes slightly more pronounced if you look at the top 10, where 8 (80%) of the most productive states are also highly taxed. Just taking the top 5, you have 100%! If the model you proposed were correct, you’d expect to see the opposite trend.

Xun - the argument in the OP related directly to tax and government revenue - not tax and GDP.

Moreover, if we were to look at tax to GDP in the various states as you have pointed out - the question is not whether government revenue as a singular unit of GDP is higher or lower under “tax or no-tax” regime; rather, it is a question of what level of tax is optimal in a given economy – directly challenging the apparently modern consensus that raising taxes to cover debts/deficits is the easiest solution to solve the public sector financial woes.

Finally - to compare individual states tax burden, with no consideration for the individual and varied economic profiles of the states, is a very poor comparison at best. None of the data you’ve presented is reflective of what would happen in an individual state if the marginal taxes were increased or decreased - and therefore doesn’t speak to the OP.

I used the word “individual” there way too many times - but am too tired to change it. Sorry. :frowning:

Sure, I agree that there is a sweet-spot between those elements. But I do think it is important to first note that the US does not currently find itself on the right side of the curve. If we did, you’d expect to see slowing economies within the more highly taxed states.

Indeed, it would seem that even before the Reagan tax-cuts we were not on the right side of the curve. While I agree that there is a limit as to how much a government can tax before it becomes inhibitory to growth and, consequently, government revenue I do think taxes can be safely raised to pay for many necessary social programs in the US. Europe may have more problems there, since their tax rates do tend to be substantially higher and raising them could well cause an economic slowdown.

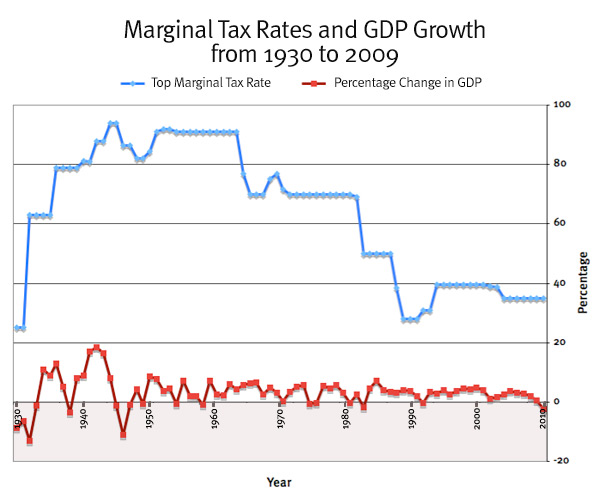
Those graphs appear to chart individual “personal” marginal tax rates to tax revenue – specifically trending an increase in revenue as marginal rates fall over 50 years, which would support a right side position on the Laffer curve, no? I may have missed something though.

Further - if they are individual tax rates - they don’t speak much to the corporate tax rates - nor does increasing government revenue speak directly to economic productivity. I’m not sure any inference about the Laffer curve can be reasonably made from the graphs you’ve posted. Again - unless I’ve completely overlooked something.

Europe will have more problems - as will Canada - for the reasons you noted (though States like NY have equal or higher marginal rates) - though not solely for those reasons. All developed nations will suffer from a demographic inversion that will likely make future taxes increases impossible. Just an opinion though.

Neither. Either policy is just pissing in the wind and propping up an economic system that have proved it is inadequate by almost every measure available.

Hmmm, you may well be right about that graph. I hadn’t thought about it that way, but what you are saying does make sense. Though the information about the states is total tax burden, so at least that remains. I’ll have to check out the stats on government revenue in those states.

This curve is more or less moot with regards to the present situation, in which either the banking system is allowed to collapse (deflationnary route) or it is kept afloat through a massive increase in the monetary base (inflationnary route). With the (less painful) deflationnary route, keeping taxes low and rebuilding an industrial base would have been the best bet to revive the economy.

[quote=“The Paineful Truth”]
If the government raises taxes do revenues increase to pay off the deficit or increase government programs? Disregarding other factors such as government large or small (what’s that like) government spendig, or the economy being robust or limp (and they are tied together), the answer is very simple as has been demonstrated by past tax cuts and increases.

K: Simply not true. You point out JFK, reagan and bush lite. Think about it a minute and you can see why this is not true… Its ok, I can wait.
Ok, how long does it take for a tax cut to go through the economy? Economist say two years. Think about the two years after each tax cut…
Give up? After JFK, was the increase in the Vietnam war, which is not a tax cut but a version of keynesian economics. Each president you mention
grew the economy the old fashion way which is depression era growth of the government which pump money into the economy, not the tax cuts. Reagan
use his massive increase in military spending to act as a an keynesian economic pump. Cutting taxes, for every dollar spent, it only put out 83 cents.
whereas building a road, for every dollar spent, creates $2.47. AS for bush lite, Iraq and Afghanistan is classic keynesian economics, done wrong however
the cost of building a tank, does not benefit the people it should benefit, which is the lower and middle class. Tax cuts are a classic war on those classes,
because it is never done for their benefit and in fact the burden of the tax cuts is on the middle and lower class for the upper class advantage. a tax cut
only benefits the wealthy, think about why? Who uses the services that tax cuts destroy? The middle and lower class for which they have to pay a higher percentage of their disposable income to replace those defunct services, so in fact after a tax cut, the middle and lower class have to spend a greater
% of their income, which defeats the point of a tax cut for those classes.

Kropotkin

Even if you believe that lowering taxes doesn’t actually raise government revenues, how did we lower the top tax rate from 70 to 28% without an enormous down turn in government revenues, government spending notwithstanding?

econlib.org/library/Enc/Marg … Rates.html

That’s exactly what we’re seeing now, corporations sitting on large amounts of cash, but how much of our problems are due to disincentive and how much to the fearful economic outlook combined with unknown government control and/or trends toward nationalization is arguable.

I take it that we are in agreement with JFK’s rising tide analogy (which was turned into the media’s representation of it as “trickle down economics” during the Reagan years.)

One other point, raising corporate taxes, on top of being double taxation on consumers who must pay those taxes, drives operations, jobs and incomes off shore in direct proportion. Add to that the capital gains taxes which are very high on an international standard, works against capital formation in this country. We are really fighting ourselves in an effort to pay for things we couldn’t afford in the first place, and it is all pre-Obamacare.