Just a little bit of genuine interest would do. Interest in your own code.
One doesn’t dare sympathize, for it is clearly beyond one.
But it must be most terrible, most annoying, to have to deal with lowly misers.
I can only wish God’s vengeance upon them, for placing obstacles in the roads of true mastery and excellence.
We will go back to our own clearly inferior and inadequate musings on probability and statistics, surely sullying the very world a master may walk.
1 Like
Which would basically put us here.
Obviously not addressed to the truly advanced and genius minds.
But to despicable rabble.
I learned something absolutely fascinating and tragic today: the gambler’s fallacy is on record as leading to some deaths in Italy.
No 53 puts Italy out of its lottery agony | World news | The Guardian.
.
Mad!
This doesn’t follow. If each flip was 50-50, some would stay tails-heavy forever, some would stay heads-heavy forever, and some would go back.
You’re going to hate this, but I made another chart:
This should help explain why the overall composition is predictable even though the flips are random.
The numbers in the boxes are ‘heaviness’, where heaviness = heads-tails. So we start at 0, and the first flip leaves at +1 (heads) or -1 (tails):
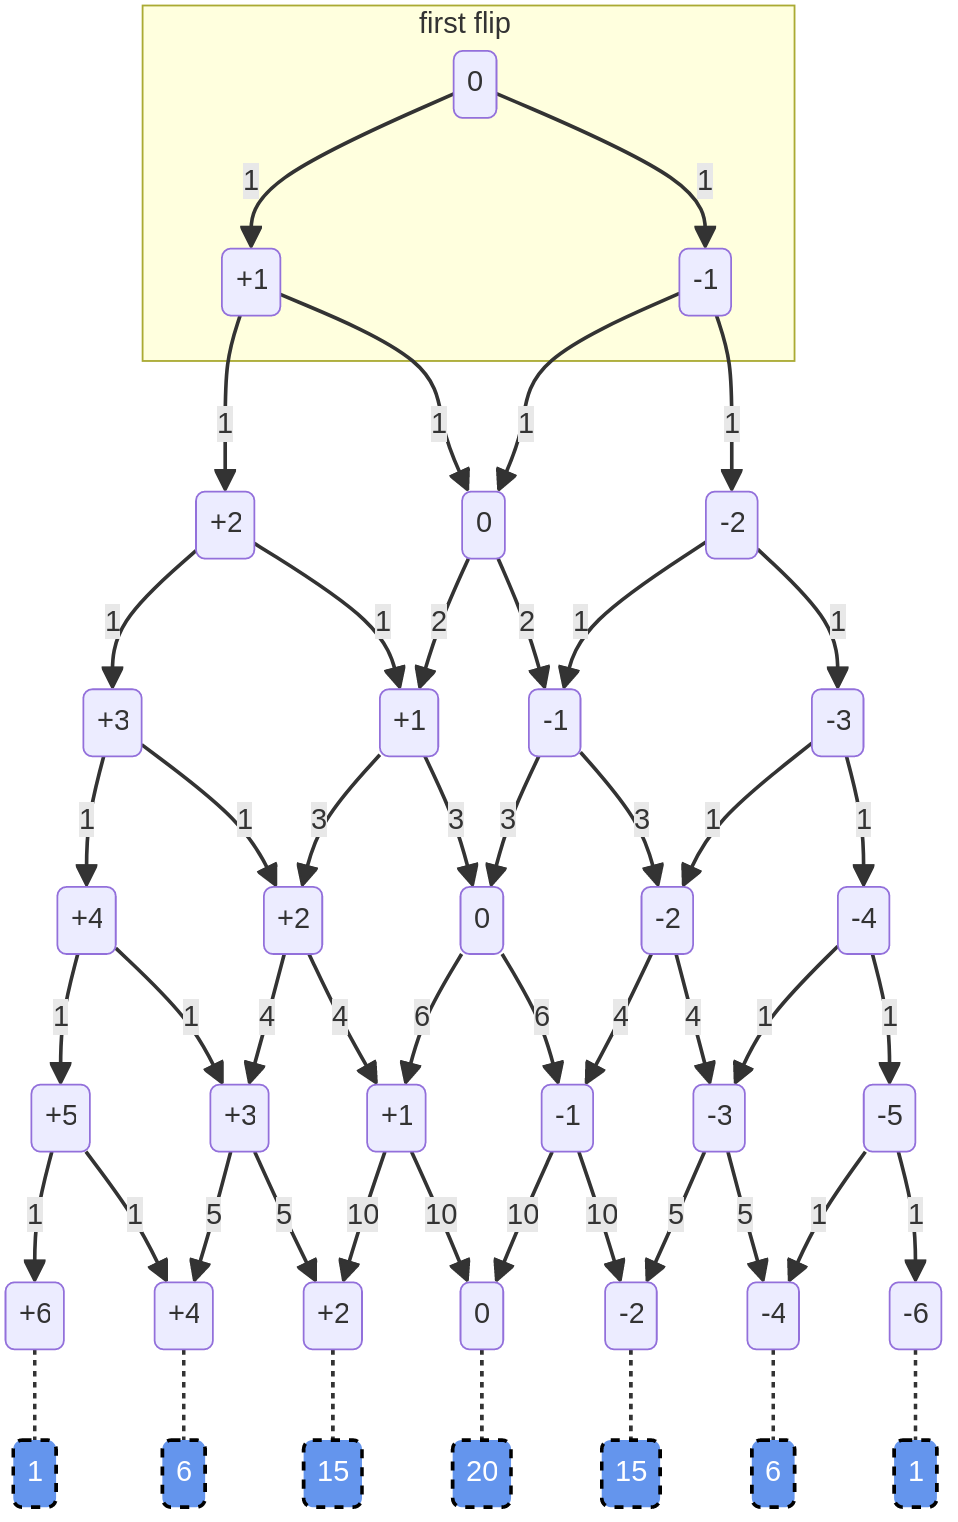
The numbers along the arrows count the number of ways to get to that arrow: on the first flip, there’s two paths, and one way to get to each: one heads or one tails. Same on the second flip: because none of the paths has crossed yet, there’s only one way to get to each path:
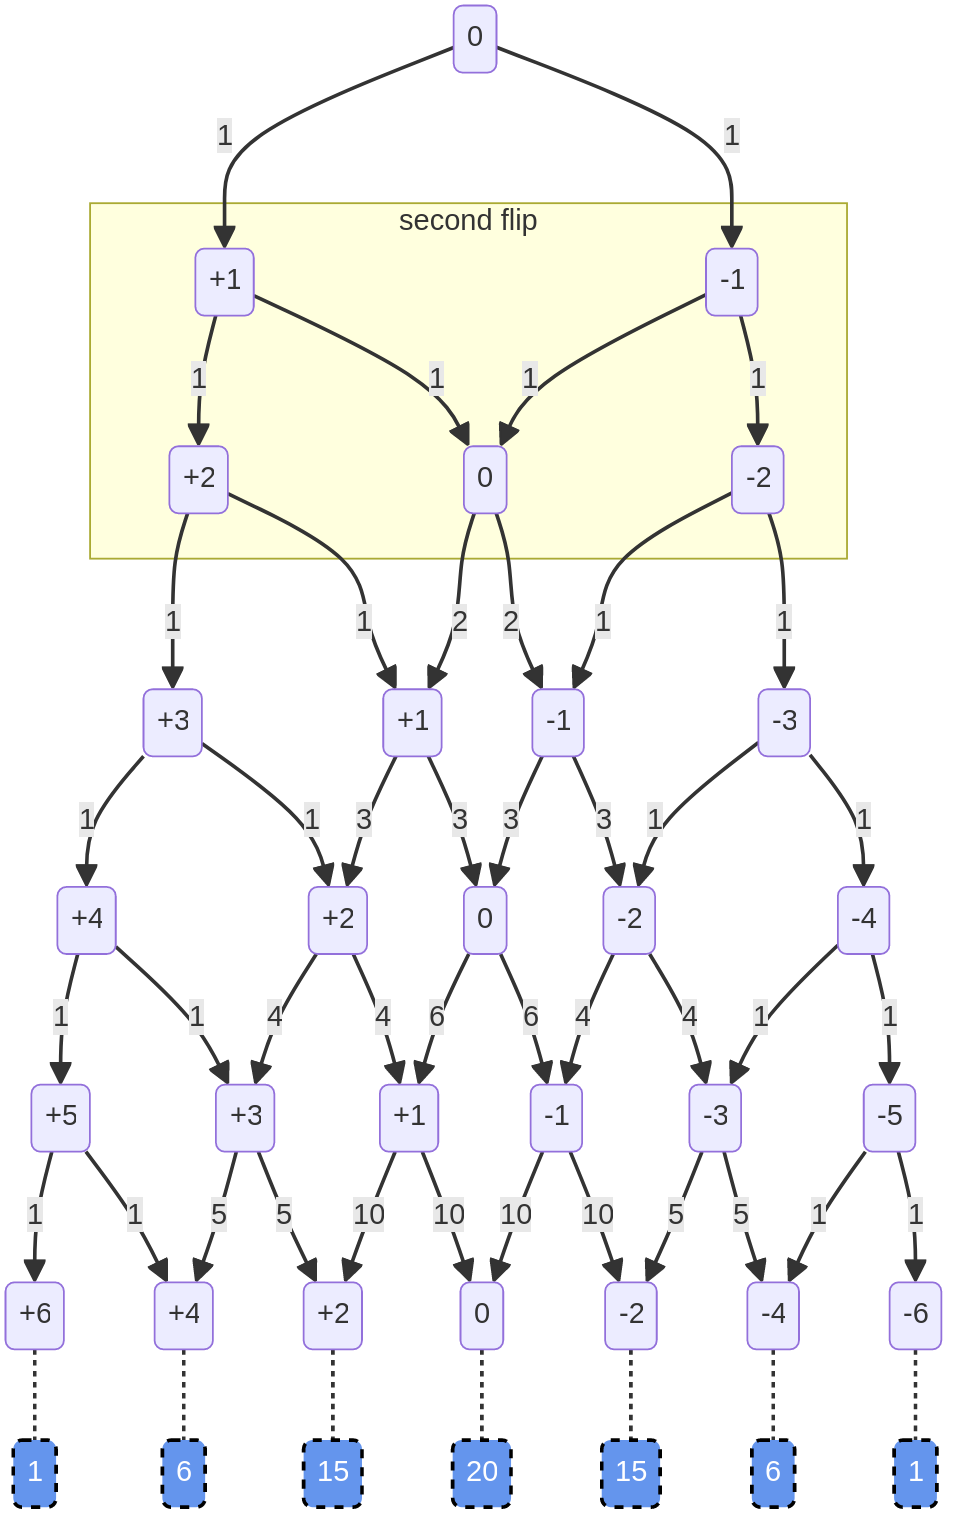
But there are two ways to get to 0: the path from the left (i.e. HT) and the path from the right (i.e. TH). If we add up the numbers on the paths pointing to a particular box, we get the number of ways to get to that heaviness in that number of flips.
And if you look at the paths coming out 0, each is labeled 2, the heaviness of the box they start from:
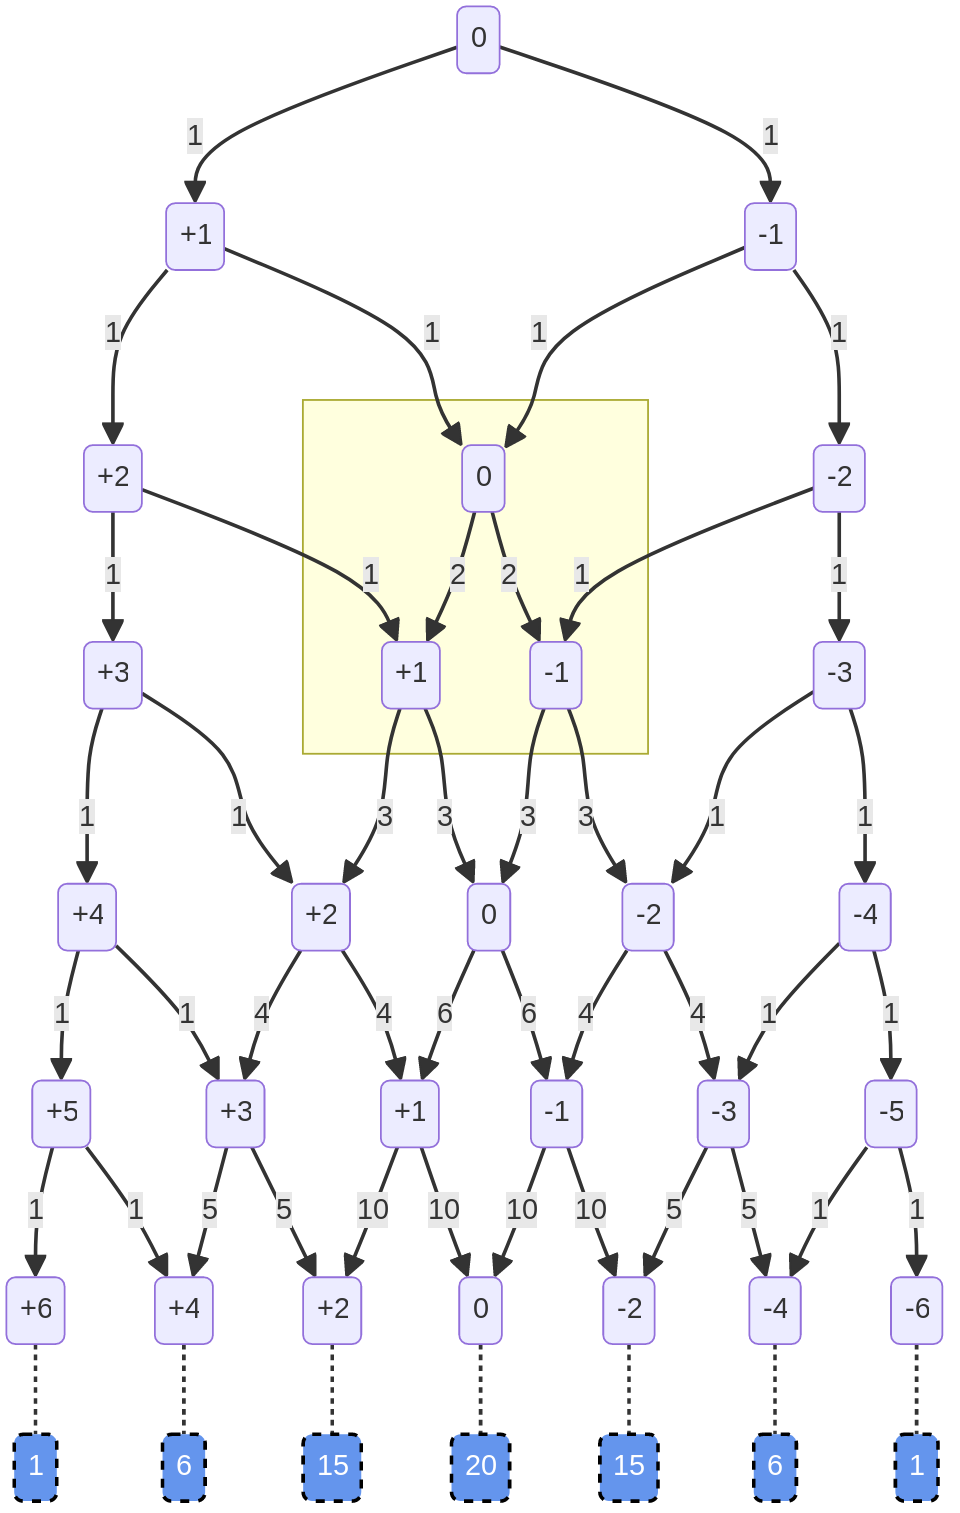
For example, the path on the left is the case where 1) we’ve flipped the coin three times, and 2) the first two flips left us with no imbalance, and 3) now we’ve flipped heads. That can happen if we flipped HTH or THH.
However, there are three ways to be at +1 heaviness after the third flip: HTH, THH, or HHT. Adding the paths flowing into that box gives us three, because there two ways to get to 0 on the second flip, and one way to get to +2.
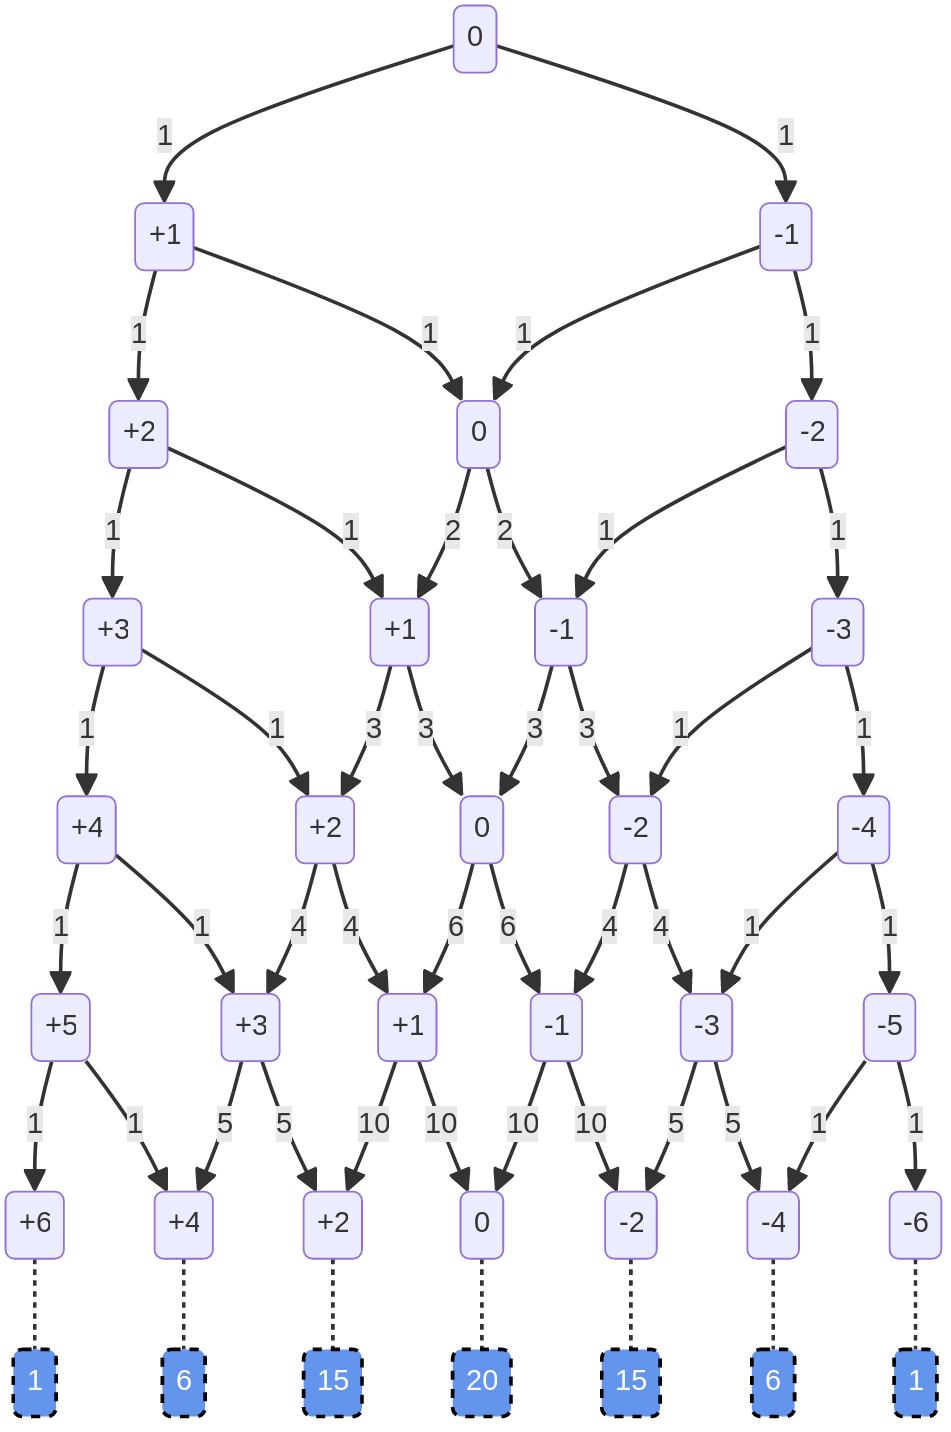
Assuming you are with me so far, jump down to the 6th flip:
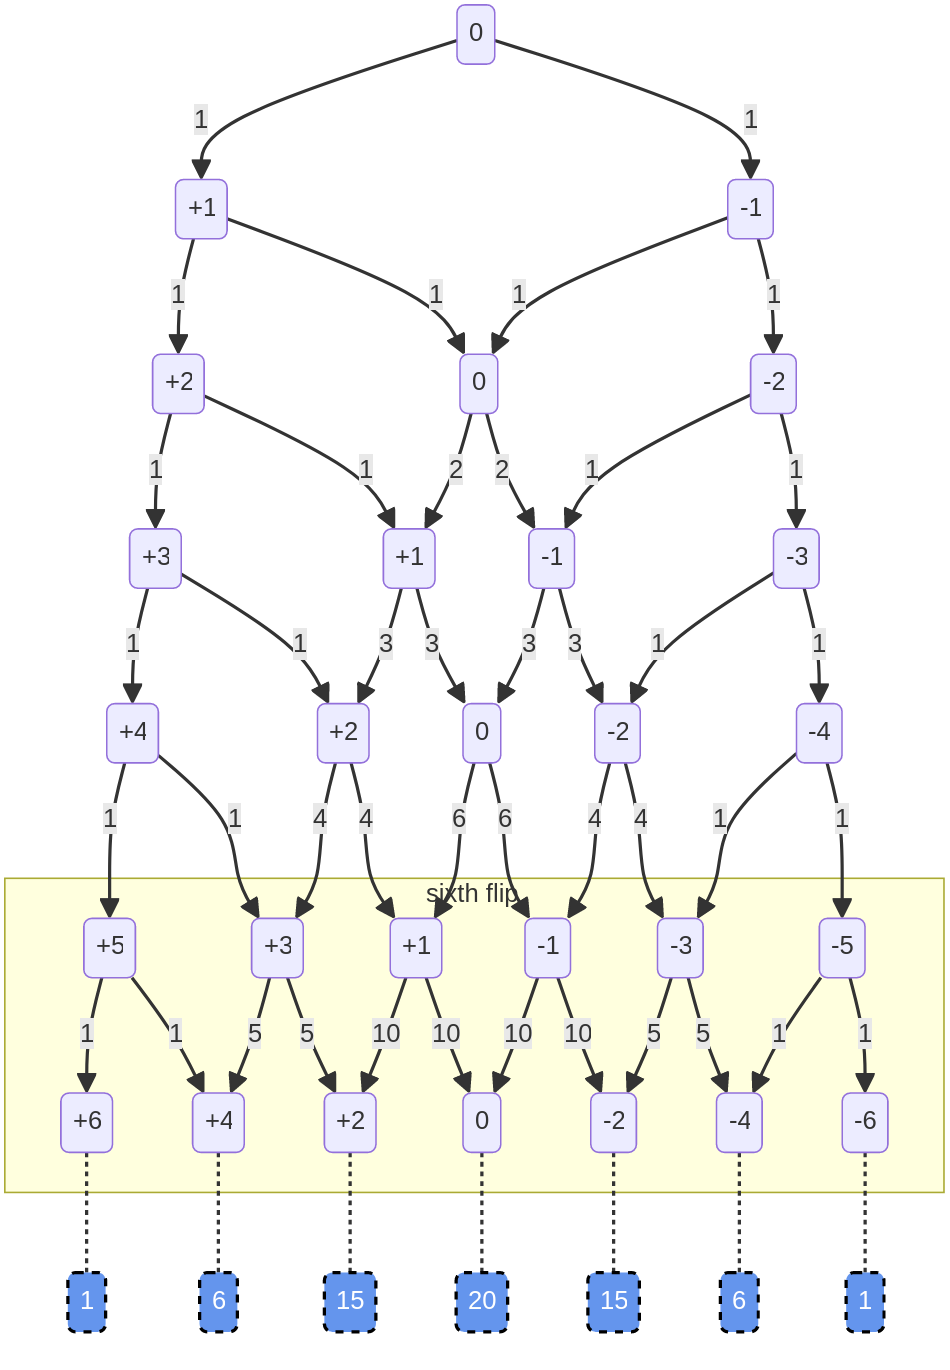
Here we can see that the possible paths to a given heaviness really adds up. There are 10 paths from -1 to 0 heaviness on the 6th flip, and 10 paths from +1 to 0, so if we’re balanced after the 6th flip, there will be 20 ways we could have gotten there.
For easy of reference, the total paths to each heaviness after the 6th flip are provided in the blue boxes at the bottom:
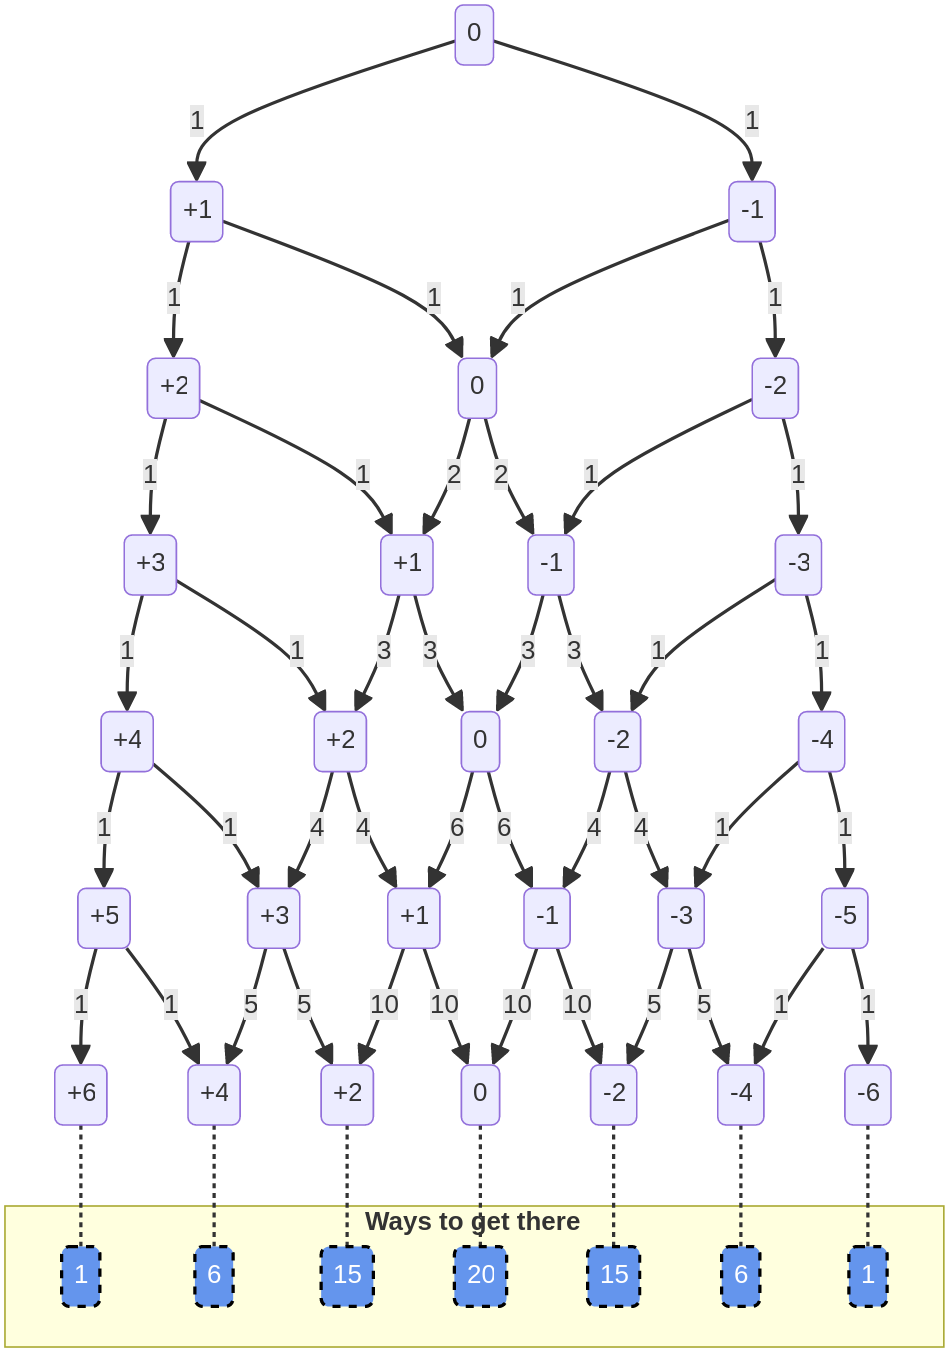
Here we see the net effect, and how this chart shows that the outcome can be both random and follow a predictable distribution. We already knew that there are 64 possible sequences of 6 flips (2^6) – of thos, 50 possible paths leave us with +2, 0, and -2, heaviness.
As with previous graphs, this was an assache to produce, but I fully expect the trend to continue as we add flips.
Without talking about probability at all, there are just more ways to have a balanced series of flips than an imbalanced series. Like if you just lined up coins on the floor in groups of six, and made every possible series of heads and tails, most of the lines would be close to an even mix of heads and tails.
I’ll write up a script to see how concentrated it gets, but hopefully the chart clarifies the point I’m making: the likely distribution depends on all the ways that distribution can be arrived at – what’s possible influences what’s probable.
Right, so now, you have made a falsifiable claim.
Go forth now and produce a 10 mill flip where it goes heavy and stays heavy. A single one, I only want one. You can do a million 10 mill flips if you want. Find me one example.
You are right, I didn’t bother with any of them. Even though I can’t help admire the work that goes into them.
I’m not trying to be rude, but if you can’t put it into simple rhetorical language, you don’t understand it enough yourself to explain it to me from a graph.
Here, I cut out some of the work for you.
It’s my same program but it counts heads heavy too.
As long as heads heavy and tails heavy each have at least 1, it came back from the heavy state.
Funny how life works.
You will find that, in instances where one heavy state is much smaller than the other, it will proportionally overrepresent the overall underrepresented instance by a far greater margin, every time that I could detect but eventually an exception would probably come along, than it will undercut the overrepresented overall instance.
Iow, a smaller tails heavy sample than heads heavy sample will give a proportion of tails heavy heads that outruns the proportion of overall heads by a far wider margin than heads heavy heads will underperform overall heads.
Mast be magic, man.
Really well illustrated. And if you follow the pathways down, it’s so obvious that many pathways swap sides. It’s also obvious that only one of the many pathways is all tails, and only one is all heads.
Is a coin more likely to flip tails of it has already flipped heads a bunch?
You’re goddamn right.
By the way, this means that if you notice that a heavy series is outperforming the overall series by more than a certain amount, you can predict that it will likely be short.
Duh, conforming to an overall 50 50 balance.
What does this mean for a per flip calculation?
Hm.
It means that a flip preceded by a series that is fairly balanced, then sharply imbalanced, is more likely to be the result opposite the imbalance than a similar flip with a similar imbalance, but which had a more balanced overall preceding series, rather than fairly balanced and then suddenly sharply imbalanced.
Whiplash, if you will.
I’m giving you bastards too much.
Yeah, it shows.
Here’s a program that does what you’re asking for. It iterates sequences of 10m flips, adding +1 or -1 to a balance variable. If it gets through all 10m flips without returning to 0, it scores a success, otherwise it’s a failure.
I get about 2 successes every 10k iterations (.02%). That seems in line with the explanation in my last post.
This is the program that tests that question directly:
You call that directly?
Directly is;
flip a bunch of times
Find the times that fit
Count them.
Compare them to when it has not
See if there is a difference in likelihood.
That is direct.